Contents
- CRFB2_empir_ARL_profile.m
- Get started
- Design parameters
- Load the data
- Group descriptors
- Collect the ARLs for each group
- Plot the 28-trial ARL profiles
- Plot the 42-trial ARL profiles
- Production-quality plot of Motion ARL42
- Production-quality plot of Texture ARL42
- Define Assimilation
- Plot the 28-trial Assimilation profiles
- Plot the 42-trial Assimilation profiles
- Production-quality plot of Motion Assim42
- Production-quality plot of Texture Assim42
- Export MTN-ARL42 to SSPS for repeated-measures ANOVA
- Export TXT-ARL42 to SSPS for repeated-measures ANOVA
- Clean up
CRFB2_empir_ARL_profile.m
Final plot of the empirical Avg Response Levels w/ 56-trial blocks. See Figures 4 and 5 in ProtoPaper/expmt.tex. Compare with model_ARL2_predictions.m
File: work/MLExper/CRFeedback2/prog/CRFB2_empir_ARL_profile.m
Usage: publish('CRFB2_empir_ARL_profile.m','html') ;    % 'latex','doc','ppt'
Date: 2009-12-29
% 1.1.1 2009-12-29 AP: Export the ARL42 profiles to ASCII data files % 1.1.0 2009-12-22 AP: Linestyles as in CMUExper/fdbk1/data/empir_ARL2_profile.m % 1.0.0 2009-12-04 AP: Wrote it
Get started
cd(fullfile(CRFeedback2_pathstr,'data')) ;
fprintf('\n\nCRFB2_empir_ARL_profile executed on %s.\n\n',datestr(now)) ;
fprintf('cd %s\n',pwd) ;

clear all ;
CRFB2_empir_ARL_profile executed on 28-Dec-2009 19:11:56.

cd /Users/apetrov/a/r/w/work/MLExper/CRFeedback2/data
Design parameters
Load them from the code that administered the experiment:
P = CRFB2_params(0) ;
design_params = P.design_params ;

MOTION = P.enum.MOTION ;
TEXTURE = P.enum.TEXTURE ;

FAST_LOW = P.enum.FAST_LOW ;
SLOW_HIGH = P.enum.SLOW_HIGH ;
UNIF = P.enum.UNIF ;

idx1 = [1 2 3 6 7] ;  % feedback blocks42 for the feedback-first groups
idx2 = [1 4 5 8 9] ;  % feedback blocks42 for the no-feedback-first grps
  % @@@ See P.design_params.feedback_sched for the 28-trial blocks


x42 =     [ 7, 35:42:329] ;
xtick28 = (1.5:3:10.5) ;  % block-based, @@@@
xtick42 = (14:84:350) ;   % trial-based
xtick42b = (1.5:2:7.5) ;  % block-based

ytick_ARL = (3.0:.2:5.0) ;
axis28 = [0 14 3 5] ;     % block-based
axis42 = [0 350 3 5] ;    % trial-based
axis42b = [0 10 3 5] ;    % block-based

ytick_Assim = (-2.0:.5:0.5) ;
A_axis28 = [0 14 -2 0.5] ;  % block-based
A_axis42 = [0 350 -2 0.5] ; % trial-based
A_axis42b = [0 10 -2 0.5] ; % block-based
Load the data
H_filename = fullfile(CRFeedback2_pathstr,'data','H.mat') ;
D_filename = fullfile(CRFeedback2_pathstr,'data','D.mat') ;

%recalculatep = true ;
recalculatep = false ;
if (recalculatep || ~exist(H_filename,'file'))
    if (recalculatep || ~exist(D_filename,'file'))
        %- Write down repository revision number
        fprintf('!/usr/local/bin/svn info \n') ;
        !/usr/local/bin/svn info

        %- Concatenate the individual data files into one master ASCII file
        fprintf('!cat sbj*.dat > raw_data.dat \n') ;
        !cat sbj*.dat > raw_data.dat

        %- Import the ASCII data files to Matlab
        fprintf('\nD=CRFB2_import_data ...') ;
        g = fullfile(CRFeedback2_pathstr,'data','raw_data.dat') ;
        D = CRFB2_import_data(g,[],P) ;
        %- Save D for future use
        save(D_filename,'D') ;
        fprintf('\nsave %s \n',D_filename) ;
    else
        fprintf('load %s \n',D_filename) ;
        load(D_filename) ;
    end
    assert(exist('D','var')==1) ;

    %- Calculate the average response levels
    fprintf('\nH = CRFB2_data_by_sbj(D) ...\n') ;
    [H,P,ARL_params] = CRFB2_data_by_sbj(D,1,P) ;
    %- Save H for future use
    save(H_filename,'H') ;
    fprintf('\nsave %s \n\n',H_filename) ;
else
    fprintf('load %s \n\n',H_filename) ;
    load(H_filename) ;
end
assert(exist('H','var')==1) ;
load /Users/apetrov/a/r/w/work/MLExper/CRFeedback2/data/H.mat
Group descriptors
group_descr = {'FastLow1' 'FastLow2' 'SlowHigh1' 'SlowHigh2'} ;
group_descr = design_params.group_descr     %#ok<NOPTS>
N_groups = length(group_descr) ;            % 4
FastLow1 = 1 ;     % group identifiers
FastLow2 = 2 ;
SlowHigh1 = 3 ;
SlowHigh2 = 4 ;
%fdbk_first_p = [1 0 1 0] ;    % exp schedule by group

sbj = [H.sbj]' ;
gr = [H.group]' ;
xtab1(gr)

N_sbj = length(H) ;
group_descr =

    'FastLow1'    'FastLow2'    'SlowHigh1'    'SlowHigh2'


   Value   Count  Percent  Cum_cnt  Cum_pct
-------------------------------------------
       1      10    24.39       10    24.39
       2      10    24.39       20    48.78
       3      10    24.39       30    73.17
       4      11    26.83       41   100.00
-------------------------------------------
Collect the ARLs for each group
N_blocks28 = length(H(1).schedule28) ;
N_blocks42 = length(H(1).schedule42) ;

sbj_gr = cell(1,N_groups) ;
MTN_ARL28 = cell(1,N_groups) ;
MTN_ARL42 = cell(1,N_groups) ;
TXT_ARL28 = cell(1,N_groups) ;
TXT_ARL42 = cell(1,N_groups) ;

grMTN_ARL28 = NaN(N_blocks28,N_groups) ;
grMTN_ARL42 = NaN(N_blocks42,N_groups) ;
grTXT_ARL28 = NaN(N_blocks28,N_groups) ;
grTXT_ARL42 = NaN(N_blocks42,N_groups) ;
N_sbj_per_gr = NaN(1,N_groups) ;

for g = 1:N_groups
    idx = find(gr==g) ;

    % Demographics
    N_sbj_per_gr(g) = length(idx) ;
    sbj_gr{g} = [sbj(idx), gr(idx)] ;    % <subject, group>

    % MOTION
    MTN_ARL28{g} = [H(idx).MOTION_ARL28] ;
    grMTN_ARL28(:,g) = mean(MTN_ARL28{g},2) ;
    MTN_ARL42{g} = [H(idx).MOTION_ARL42] ;
    grMTN_ARL42(:,g) = mean(MTN_ARL42{g},2) ;

    % TEXTURE
    TXT_ARL28{g} = [H(idx).TEXTURE_ARL28] ;
    grTXT_ARL28(:,g) = mean(TXT_ARL28{g},2) ;
    TXT_ARL42{g} = [H(idx).TEXTURE_ARL42] ;
    grTXT_ARL42(:,g) = mean(TXT_ARL42{g},2) ;
end
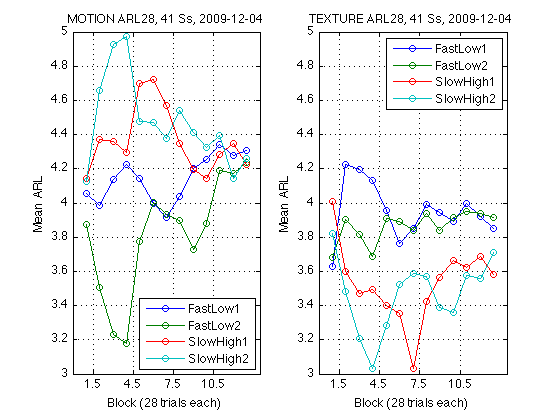
Plot the 28-trial ARL profiles
@@@ using default line colors for the time being
subplot(1,2,1) ;
plot(grMTN_ARL28,'o-') ;
axis(axis28) ; set(gca,'xtick',xtick28,'ytick',ytick_ARL) ; grid on ;
legend(group_descr,'location','SouthEast') ;
xlabel('Block (28 trials each)') ; ylabel('Mean ARL') ;
title(sprintf('MOTION ARL28, %d Ss, 2009-12-04',N_sbj)) ;

subplot(1,2,2) ;
plot(grTXT_ARL28,'o-') ;
axis(axis28) ; set(gca,'xtick',xtick28,'ytick',ytick_ARL) ; grid on ;
legend(group_descr,'location','NorthEast') ;
xlabel('Block (28 trials each)') ; ylabel('Mean ARL') ;
title(sprintf('TEXTURE ARL28, %d Ss, 2009-12-04',N_sbj)) ;
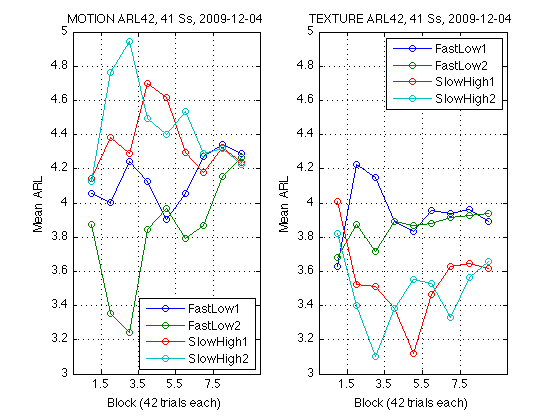
Plot the 42-trial ARL profiles
@@@ using default line colors for the time being
subplot(1,2,1) ;
plot(grMTN_ARL42,'o-') ;
axis(axis42b) ; set(gca,'xtick',xtick42b,'ytick',ytick_ARL) ; grid on ;
legend(group_descr,'location','SouthEast') ;
xlabel('Block (42 trials each)') ; ylabel('Mean ARL') ;
title(sprintf('MOTION ARL42, %d Ss, 2009-12-04',N_sbj)) ;

subplot(1,2,2) ;
plot(grTXT_ARL42,'o-') ;
axis(axis42b) ; set(gca,'xtick',xtick42b,'ytick',ytick_ARL) ; grid on ;
legend(group_descr,'location','NorthEast') ;
xlabel('Block (42 trials each)') ; ylabel('Mean ARL') ;
title(sprintf('TEXTURE ARL42, %d Ss, 2009-12-04',N_sbj)) ;
Production-quality plot of Motion ARL42
Same LineStyles as CMUExper/fdbk1/data/empir_ARL2_profile.m
ls =      {'b-'      'k<-'    'b--'     'k<--'} ; % group line styles
lw =      [2         2        2         2] ;      % group line widths
MTN_leg = {'Slow1'   'Fast1'  'Slow2'   'Fast2'} ;
MTN_gr4 = [SlowHigh1 FastLow1 SlowHigh2 FastLow2] ;
for k = 1:4    % Add group number in the legend
    MTN_leg{k} = sprintf('Group %d: %s',MTN_gr4(k),MTN_leg{k}) ;
end
disp([group_descr(MTN_gr4) ; MTN_leg]) ;  % should match

clf ; hold on ;
for k = 1:4
    g = MTN_gr4(k) ;
    hh = plot(x42,grMTN_ARL42(:,g),ls{k}) ;
    set(hh,'LineWidth',lw(k),'MarkerSize',4) ;
end
hold off ; box on ;
axis(axis42) ; set(gca,'xtick',xtick42,'ytick',ytick_ARL,'xgrid','on') ;
hh = xlabel('Motion Trial') ; set(hh,'FontSize',14) ;
hh = ylabel('Average response level') ; set(hh,'FontSize',14) ;
hh = legend(MTN_leg,'location','SouthEast') ; set(hh,'FontSize',14) ;
%hh = legend(group_descr(MTN_gr4),'location','SouthEast') ; set(hh,'FontSize',14) ;
% Saved as work/papers/ProtoPaper/fig/ARL-motion.eps, 2009-12-28
% Preview.app converted it to ARL-motion.pdf
    'SlowHigh1'         'FastLow1'          'SlowHigh2'         'FastLow2'
    'Group 3: Slow1'    'Group 1: Fast1'    'Group 4: Slow2'    'Group 2: Fast2'

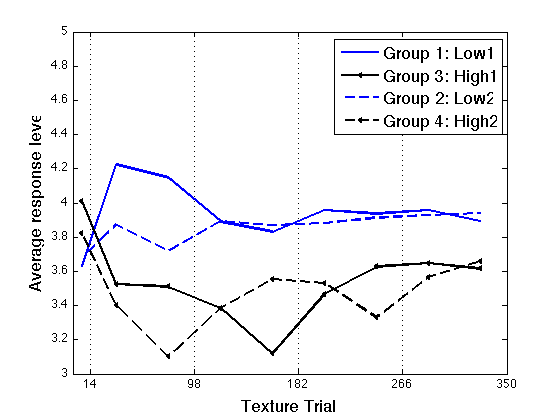
Production-quality plot of Texture ARL42
Same LineStyles as CMUExper/fdbk1/data/empir_ARL2_profile.m
%ls =     {'b-'      'k<-'    'b--'     'k<--'} ; % group line styles
%lw =     [2         2        2         2] ;      % group line widths
TXT_leg = {'Low1'    'High1'  'Low2'   'High2'} ;
TXT_gr4 = [FastLow1 SlowHigh1 FastLow2 SlowHigh2] ;
for k = 1:4    % Add group number in the legend
    TXT_leg{k} = sprintf('Group %d: %s',TXT_gr4(k),TXT_leg{k}) ;
end
disp([group_descr(TXT_gr4) ; TXT_leg]) ;  % should match

clf ; hold on ;
for k = 1:4
    g = TXT_gr4(k) ;
    hh = plot(x42,grTXT_ARL42(:,g),ls{k}) ;
    set(hh,'LineWidth',lw(k),'MarkerSize',4) ;
end
hold off ; box on ;
axis(axis42) ; set(gca,'xtick',xtick42,'ytick',ytick_ARL,'xgrid','on') ;
hh = xlabel('Texture Trial') ; set(hh,'FontSize',14) ;
hh = ylabel('Average response level') ; set(hh,'FontSize',14) ;
hh = legend(TXT_leg,'location','NorthEast') ; set(hh,'FontSize',14) ;
%hh = legend(group_descr(TXT_gr4),'location','NorthEast') ; set(hh,'FontSize',14) ;
% Saved as work/papers/ProtoPaper/fig/ARL-texture.eps, 2009-12-28
% Preview.app converted it to ARL-texture.pdf
    'FastLow1'         'SlowHigh1'         'FastLow2'         'SlowHigh2'
    'Group 1: Low1'    'Group 3: High1'    'Group 2: Low2'    'Group 4: High2'
Define Assimilation
Assim_legend = {'Fdbk 1st','No-fdbk 1st'} ;

grMTN_Assim28 = grMTN_ARL28(:,[FastLow1  FastLow2]) - ...   % Fast
                grMTN_ARL28(:,[SlowHigh1 SlowHigh2]) ;      % Slow

grMTN_Assim42 = grMTN_ARL42(:,[FastLow1  FastLow2]) - ...   % Fast
                grMTN_ARL42(:,[SlowHigh1 SlowHigh2]) ;      % Slow

MTN_A_leg = {sprintf('Gr%d - Gr%d: Feedback first',FastLow1,SlowHigh1) ...
             sprintf('Gr%d - Gr%d: No-feedback first',FastLow2,SlowHigh2)} ;


grTXT_Assim28 = grTXT_ARL28(:,[SlowHigh1 SlowHigh2]) - ...  % High
                grTXT_ARL28(:,[FastLow1  FastLow2]) ;       % Low

grTXT_Assim42 = grTXT_ARL42(:,[SlowHigh1 SlowHigh2]) - ...  % High
                grTXT_ARL42(:,[FastLow1  FastLow2]) ;       % Low

TXT_A_leg = {sprintf('Gr%d - Gr%d: Feedback first',SlowHigh1,FastLow1) ...
             sprintf('Gr%d - Gr%d: No-feedback first',SlowHigh2,FastLow2)} ;
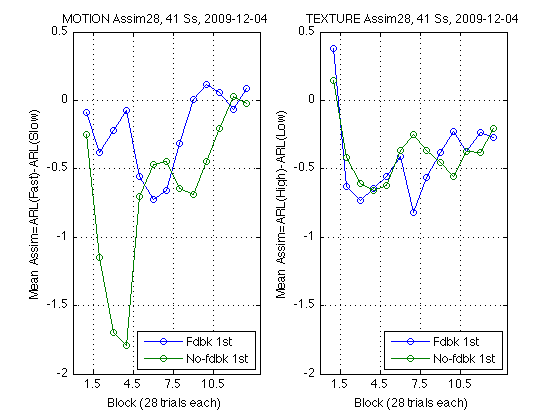
Plot the 28-trial Assimilation profiles
@@@ using default line colors for the time being
subplot(1,2,1) ;
plot(grMTN_Assim28,'o-') ;
axis(A_axis28) ; set(gca,'xtick',xtick28,'ytick',ytick_Assim) ; grid on ;
legend(Assim_legend,'location','SouthEast') ;
xlabel('Block (28 trials each)') ;
ylabel('Mean Assim=ARL(Fast)-ARL(Slow)') ;
title(sprintf('MOTION Assim28, %d Ss, 2009-12-04',N_sbj)) ;

subplot(1,2,2) ;
plot(grTXT_Assim28,'o-') ;
axis(A_axis28) ; set(gca,'xtick',xtick28,'ytick',ytick_Assim) ; grid on ;
legend(Assim_legend,'location','SouthEast') ;
xlabel('Block (28 trials each)') ;
ylabel('Mean Assim=ARL(High)-ARL(Low)') ;
title(sprintf('TEXTURE Assim28, %d Ss, 2009-12-04',N_sbj)) ;
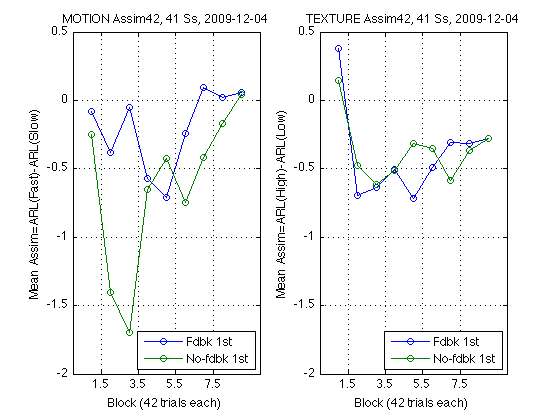
Plot the 42-trial Assimilation profiles
@@@ using default line colors for the time being
subplot(1,2,1) ;
plot(grMTN_Assim42,'o-') ;
axis(A_axis42b) ; set(gca,'xtick',xtick42b,'ytick',ytick_Assim) ; grid on ;
legend(Assim_legend,'location','SouthEast') ;
xlabel('Block (42 trials each)') ;
ylabel('Mean Assim=ARL(Fast)-ARL(Slow)') ;
title(sprintf('MOTION Assim42, %d Ss, 2009-12-04',N_sbj)) ;

subplot(1,2,2) ;
plot(grTXT_Assim42,'o-') ;
axis(A_axis42b) ; set(gca,'xtick',xtick42b,'ytick',ytick_Assim) ; grid on ;
legend(Assim_legend,'location','SouthEast') ;
xlabel('Block (42 trials each)') ;
ylabel('Mean Assim=ARL(High)-ARL(Low)') ;
title(sprintf('TEXTURE Assim42, %d Ss, 2009-12-04',N_sbj)) ;
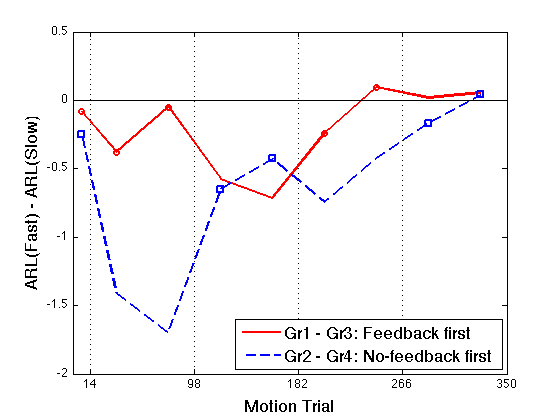
Production-quality plot of Motion Assim42
Same LineStyles as CMUExper/fdbk1/data/empir_ARL2_profile.m
clf ;
hh = plot(x42,grMTN_Assim42(:,1),'r-' ...
         ,x42,grMTN_Assim42(:,2),'b--' ...
         ,x42(idx1),grMTN_Assim42(idx1,1),'ro' ...
         ,x42(idx2),grMTN_Assim42(idx2,2),'bs' ) ;
set(hh,'LineWidth',2) ;
axis(A_axis42) ;
hh=refline(0,0) ; set(hh,'Color','k','LineStyle','-','LineWidth',1) ;
box on ;
set(gca,'xtick',xtick42,'ytick',ytick_Assim,'xgrid','on') ;
hh = xlabel('Motion Trial') ; set(hh,'FontSize',14) ;
hh = ylabel('ARL(Fast) - ARL(Slow)') ; set(hh,'FontSize',14) ;
hh = legend(MTN_A_leg,'Location','SouthEast') ; set(hh,'FontSize',14) ;
% Saved as work/papers/ProtoPaper/fig/Assim-motion.eps, 2009-12-28
% Preview.app converted it to Assim-motion.pdf
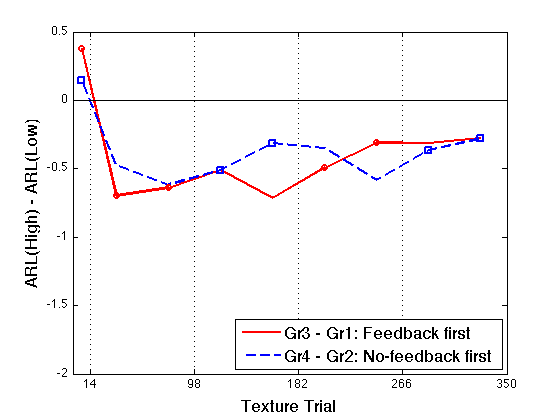
Production-quality plot of Texture Assim42
Same LineStyles as CMUExper/fdbk1/data/empir_ARL2_profile.m
clf ;
hh = plot(x42,grTXT_Assim42(:,1),'r-' ...
         ,x42,grTXT_Assim42(:,2),'b--' ...
         ,x42(idx1),grTXT_Assim42(idx1,1),'ro' ...
         ,x42(idx2),grTXT_Assim42(idx2,2),'bs' ) ;
set(hh,'LineWidth',2) ;
axis(A_axis42) ;
hh=refline(0,0) ; set(hh,'Color','k','LineStyle','-','LineWidth',1) ;
box on ;
set(gca,'xtick',xtick42,'ytick',ytick_Assim,'xgrid','on') ;
hh = xlabel('Texture Trial') ; set(hh,'FontSize',14) ;
hh = ylabel('ARL(High) - ARL(Low)') ; set(hh,'FontSize',14) ;
hh = legend(TXT_A_leg,'Location','SouthEast') ; set(hh,'FontSize',14) ;
% Saved as work/papers/ProtoPaper/fig/Assim-texture.eps, 2009-12-28
% Preview.app converted it to Assim-texture.pdf
Export MTN-ARL42 to SSPS for repeated-measures ANOVA
Write an ASCII file with one row per subject and the following columns:
- 1. Sbj -- Subject number (451-492, 999)
- 2. Group -- 1=FastLow1, 2=FastLow2, 3=SlowHigh1, 4=SlowHigh2
- 3. Task -- 1=MOTION throughout
- 4. Context -- 1=Slow, 2=Fast
- 5. Order -- 1=Feedback_first, 2=No_feedback_first
- 6. W -- ARL2 value for the "warm-up" initial block
- 7-10. F1-F4 -- ARL42 values during the four feedback blocks
- 11-14. N1-N4 -- ARL42 values during the four no-feedback blocks
Note that this data format throws away the temporal order of observations. They are rearranged depending on Order so that in the resulting ASCII file all feedback ARLs are listed in columns F1-F4 and all no-feedback ARLs are listed in columns N1-N4.
Results of SPSS analyses available in work/MLExper/CRFeedback2/SPSS/
rearrange = [1, 2 3 6 7, 4 5 8 9 ; ...     % when order=1
             1, 4 5 8 9, 2 3 6 7 ]' ;      % when order=2
order_by_group = [1 2 1 2] ;        % FastLow1, FastLow2, SlowHigh1, SlowHigh2
MTN_context_by_group = [2 2 1 1] ;  % FastLow1, FastLow2, SlowHigh1, SlowHigh2

%- Prepare a matrix with the relevant data in the proper format
MTN_data42 = NaN(N_sbj,14) ;
for k = 1:N_sbj
    MTN_data42(k,1) = H(k).sbj ;
    g = H(k).group ;
    MTN_data42(k,2) = g ;
    MTN_data42(k,3) = MOTION ;                % = const
    MTN_data42(k,4) = MTN_context_by_group(g) ;
    MTN_data42(k,5) = order_by_group(g) ;
    idx = rearrange(:,order_by_group(g)) ;
    MTN_data42(k,6:14) = H(k).MOTION_ARL42(idx) ;
end

%- Sanity check
for g = 1:N_groups
    idx = find(MTN_data42(:,2)==g) ;
    hh = mean(MTN_data42(idx,6:14)) ;  %#ok<FNDSB> % rearranged mean_ARL for this group
    assert(all(grMTN_ARL42(rearrange(:,order_by_group(g)),g)==hh')) ;
end

% Write to an ASCII file
fid = fopen(fullfile(CRFeedback2_pathstr,'SPSS','MTN-ARL42-wn-Ss.dat'),'w') ;
hh = [fid 1] ;   % Echo on stdout using fprintN
fprintN(hh,'Sbj Group Task Context Order W F1 F2 F3 F4 N1 N2 N3 N4\n') ;
for k = 1:N_sbj
    fprintN(hh,...
      '%02d %1d %1d %1d %1d %5.3f %5.3f %5.3f %5.3f %5.3f %5.3f %5.3f %5.3f %5.3f\n',...
      MTN_data42(k,:)) ;
end
fclose(fid) ;
Sbj Group Task Context Order W F1 F2 F3 F4 N1 N2 N3 N4
451 4 1 1 2 3.643 4.844 4.211 4.710 4.511 5.029 5.378 4.820 4.854
452 1 1 2 1 4.071 3.656 3.758 3.867 4.093 3.908 3.753 4.770 4.168
453 1 1 2 1 3.214 3.609 3.432 3.444 3.666 3.968 3.132 3.274 4.105
454 4 1 1 2 4.143 4.025 3.848 4.191 4.113 3.906 3.943 3.980 4.025
455 3 1 1 1 4.143 4.428 4.793 4.299 4.151 5.017 4.318 4.953 4.612
456 4 1 1 2 5.184 4.777 4.221 3.877 3.943 5.441 5.179 4.212 3.546
457 3 1 1 1 4.111 4.060 4.131 4.129 4.212 4.417 4.915 4.045 4.566
458 4 1 1 2 4.643 4.527 4.756 4.040 4.237 4.690 5.282 4.257 4.338
459 2 1 2 2 4.357 3.930 4.847 5.051 4.292 3.959 3.576 4.384 3.640
460 2 1 2 2 4.082 4.439 3.963 4.064 4.076 3.233 4.387 3.388 4.189
461 3 1 1 1 4.428 4.395 4.140 4.800 4.180 4.827 4.780 4.463 4.489
462 1 1 2 1 3.869 4.608 4.454 4.478 4.219 4.420 4.203 3.953 3.590
463 2 1 2 2 3.065 3.779 3.579 4.072 4.498 2.558 2.899 3.730 4.094
464 1 1 2 1 3.071 4.184 4.328 3.881 4.565 4.556 4.161 3.960 3.870
465 3 1 1 1 4.694 4.854 4.238 4.004 4.193 4.585 4.681 4.097 3.499
468 3 1 1 1 4.143 4.894 4.584 4.367 4.624 5.094 4.912 4.512 4.426
469 2 1 2 2 3.548 3.682 3.905 3.951 4.269 3.046 2.839 3.547 3.335
470 4 1 1 2 4.000 4.052 4.512 4.540 4.360 4.444 4.655 5.189 5.218
471 3 1 1 1 3.929 4.206 4.056 3.995 3.643 4.921 4.345 3.891 3.902
472 1 1 2 1 4.357 3.905 4.716 4.569 4.709 3.950 4.399 4.505 4.441
473 2 1 2 2 3.639 3.975 3.815 4.456 4.333 2.851 2.775 3.746 4.431
474 4 1 1 2 3.648 4.692 4.709 4.828 4.387 5.322 5.757 4.693 3.895
475 2 1 2 2 4.071 3.773 3.854 3.784 4.048 3.621 3.698 3.970 4.452
476 2 1 2 2 3.924 3.829 3.652 3.440 4.181 2.878 2.241 3.705 3.072
477 4 1 1 2 2.857 5.055 4.318 4.089 3.794 4.298 4.329 4.012 2.733
478 1 1 2 1 4.000 4.468 4.675 4.215 4.790 4.869 4.578 5.183 5.453
479 3 1 1 1 4.384 4.429 4.646 4.344 4.462 5.004 4.449 4.753 4.434
480 1 1 2 1 4.000 3.525 4.406 4.288 4.311 3.761 3.788 4.739 4.591
481 1 1 2 1 4.286 3.669 3.926 3.762 3.923 3.836 3.511 4.057 4.401
482 4 1 1 2 4.643 5.049 4.563 4.707 4.496 5.138 5.535 5.213 5.392
483 1 1 2 1 4.277 3.955 4.168 4.024 3.945 3.673 2.995 4.780 4.432
484 3 1 1 1 3.643 4.234 4.275 4.058 3.896 3.808 4.363 4.077 4.361
485 4 1 1 2 4.143 4.100 4.505 4.147 4.392 4.941 5.107 4.746 4.365
486 4 1 1 2 3.857 4.697 4.820 4.897 4.691 5.178 5.351 4.777 5.361
487 2 1 2 2 4.365 4.021 3.886 4.446 4.363 4.207 3.988 3.661 4.087
488 2 1 2 2 4.071 3.617 4.096 4.262 4.096 3.941 2.972 3.943 3.712
489 1 1 2 1 5.434 4.420 4.543 4.033 4.516 4.290 4.515 4.201 3.860
490 2 1 2 2 3.637 3.402 4.111 3.994 4.488 3.261 3.051 3.833 3.658
491 3 1 1 1 3.667 4.283 4.044 4.388 4.058 4.122 4.520 3.756 3.291
492 4 1 1 2 4.605 3.606 3.925 3.478 3.527 4.006 3.847 4.003 3.435
999 3 1 1 1 4.286 4.017 3.991 4.575 4.363 5.174 4.863 4.686 4.784
Export TXT-ARL42 to SSPS for repeated-measures ANOVA
Write an ASCII file with one row per subject and the following columns:
- 1. Sbj -- Subject number (451-492, 999)
- 2. Group -- 1=FastLow1, 2=FastLow2, 3=SlowHigh1, 4=SlowHigh2
- 3. Task -- 2=TEXTURE throughout
- 4. Context -- 3=Low, 4=High
- 5. Order -- 1=Feedback_first, 2=No_feedback_first
- 6. W -- ARL2 value for the "warm-up" initial block
- 7-10. F1-F4 -- ARL42 values during the four feedback blocks
- 11-14. N1-N4 -- ARL42 values during the four no-feedback blocks
Note that this data format throws away the temporal order of observations. They are rearranged depending on Order so that in the resulting ASCII file all feedback ARLs are listed in columns F1-F4 and all no-feedback ARLs are listed in columns N1-N4.
Results of SPSS analyses available in work/MLExper/CRFeedback2/SPSS/
TXT_context_by_group = [3 3 4 4] ;  % FastLow1, FastLow2, SlowHigh1, SlowHigh2

%- Prepare a matrix with the relevant data in the proper format
TXT_data42 = NaN(N_sbj,14) ;
for k = 1:N_sbj
    TXT_data42(k,1) = H(k).sbj ;
    g = H(k).group ;
    TXT_data42(k,2) = g ;
    TXT_data42(k,3) = TEXTURE ;                % = const
    TXT_data42(k,4) = TXT_context_by_group(g) ;
    TXT_data42(k,5) = order_by_group(g) ;
    idx = rearrange(:,order_by_group(g)) ;
    TXT_data42(k,6:14) = H(k).TEXTURE_ARL42(idx) ;
end

%- Sanity check
for g = 1:N_groups
    idx = find(TXT_data42(:,2)==g) ;
    hh = mean(TXT_data42(idx,6:14)) ;  %#ok<FNDSB> % rearranged mean_ARL for this group
    assert(all(grTXT_ARL42(rearrange(:,order_by_group(g)),g)==hh')) ;
end

% Write to an ASCII file
fid = fopen(fullfile(CRFeedback2_pathstr,'SPSS','TXT-ARL42-wn-Ss.dat'),'w') ;
hh = [fid 1] ;   % Echo on stdout using fprintN
fprintN(hh,'Sbj Group Task Context Order W F1 F2 F3 F4 N1 N2 N3 N4\n') ;
for k = 1:N_sbj
    fprintN(hh,...
      '%02d %1d %1d %1d %1d %5.3f %5.3f %5.3f %5.3f %5.3f %5.3f %5.3f %5.3f %5.3f\n',...
      TXT_data42(k,:)) ;
end
fclose(fid) ;
Sbj Group Task Context Order W F1 F2 F3 F4 N1 N2 N3 N4
451 4 2 4 2 4.286 3.541 3.699 3.624 3.896 4.078 4.260 3.403 3.539
452 1 2 3 1 3.003 3.726 3.551 3.182 3.502 3.205 2.482 3.454 3.320
453 1 2 3 1 4.058 4.121 4.241 3.912 3.953 3.593 3.992 3.640 3.570
454 4 2 4 2 4.121 3.207 3.436 3.625 3.745 2.540 2.409 3.284 3.665
455 3 2 4 1 3.038 3.287 3.272 3.051 3.419 2.951 2.804 3.530 3.328
456 4 2 4 2 4.258 3.746 3.913 3.761 3.955 3.969 3.880 3.799 3.556
457 3 2 4 1 4.214 3.671 3.540 3.818 4.113 3.858 3.711 3.980 3.934
458 4 2 4 2 3.500 3.537 3.672 3.707 3.644 2.856 2.592 3.476 2.928
459 2 2 3 2 4.646 4.056 3.766 4.301 4.328 4.044 3.858 4.355 4.519
460 2 2 3 2 3.580 3.989 3.795 3.576 3.882 3.985 3.769 3.574 3.207
461 3 2 4 1 4.500 3.532 3.244 3.328 3.583 3.342 3.226 3.678 3.591
462 1 2 3 1 4.000 3.904 4.251 4.225 4.283 4.091 4.134 4.642 4.065
463 2 2 3 2 3.365 3.608 3.735 4.000 3.985 3.372 3.397 3.895 4.007
464 1 2 3 1 3.371 4.228 3.957 3.759 4.108 3.944 3.469 4.197 3.897
465 3 2 4 1 4.292 3.671 3.470 3.597 3.706 3.352 3.039 3.497 3.279
468 3 2 4 1 4.008 3.322 3.196 3.135 3.375 3.181 2.629 3.020 3.218
469 2 2 3 2 3.286 3.663 4.188 3.716 3.845 3.835 3.898 3.756 3.527
470 4 2 4 2 3.461 3.290 3.291 3.417 3.220 3.353 3.120 3.775 3.814
471 3 2 4 1 4.052 3.600 3.772 3.697 4.038 3.309 3.472 4.046 3.939
472 1 2 3 1 3.214 4.243 4.223 4.181 3.813 4.179 4.021 3.864 3.983
473 2 2 3 2 4.009 3.904 4.087 4.165 3.973 3.933 3.858 4.049 4.247
474 4 2 4 2 3.571 3.298 3.438 3.641 3.522 3.023 2.703 3.710 3.265
475 2 2 3 2 3.357 3.695 3.595 3.732 3.682 3.565 3.039 3.246 3.170
476 2 2 3 2 3.643 4.273 4.133 4.292 3.997 4.382 4.126 4.360 4.544
477 4 2 4 2 3.103 3.002 3.319 3.477 3.426 2.825 2.188 3.160 2.634
478 1 2 3 1 3.357 4.302 4.201 3.872 3.790 4.300 3.986 3.928 3.997
479 3 2 4 1 4.035 3.304 3.673 3.455 3.655 3.625 3.065 3.646 3.907
480 1 2 3 1 4.000 4.710 3.917 3.877 4.083 3.602 3.591 3.539 3.907
481 1 2 3 1 4.332 4.553 4.536 4.059 3.792 4.169 4.041 4.202 4.203
482 4 2 4 2 3.786 3.790 3.979 3.431 3.868 3.703 3.494 3.923 3.361
483 1 2 3 1 3.357 4.007 4.103 4.247 3.979 4.113 4.216 4.044 4.056
484 3 2 4 1 3.617 3.531 3.490 3.829 3.688 3.263 3.131 3.599 3.705
485 4 2 4 2 4.543 2.896 3.458 3.652 3.545 3.512 3.308 3.115 3.243
486 4 2 4 2 3.286 3.418 3.477 3.313 3.806 3.942 2.886 3.557 3.090
487 2 2 3 2 4.035 4.320 3.979 3.792 3.844 4.400 4.380 3.842 3.837
488 2 2 3 2 3.357 3.432 3.598 3.790 3.997 3.125 2.922 3.863 4.095
489 1 2 3 1 3.621 4.432 4.502 4.275 4.057 3.718 4.393 4.081 3.921
490 2 2 3 2 3.518 3.994 3.820 3.911 3.872 4.094 3.918 3.876 3.987
491 3 2 4 1 4.000 3.685 3.788 3.713 3.764 3.583 3.419 4.172 4.387
492 4 2 4 2 4.143 3.500 3.426 3.558 3.637 3.603 3.259 3.647 3.528
999 3 2 4 1 4.357 3.644 3.658 3.035 2.936 3.378 2.684 3.305 2.878
Clean up
clear D hh k g idx fid ;

% 2009-12-28