FINAL_ARL2_FITS.m
Figure 6 in .../papers/ProtoPaper/protopaper.tex
Based on .../fdbk1/data/fit_ANCHOR_ARL2_part2.m and fit_INST_ARL2_part2.m
Compare with .../fdbk1/data/model_ARL2_predictions.m
File: work/CMUExper/fdbk1/data/final_ARL2_fits.m
Date: 2007-08-20
Alexander Petrov, http://alexpetrov.com
Contents
- Load empirical ARL2 profiles
- ANCHOR -- Explore 4 alternative sets
- INST
- Figure layouts
- Run 4 ANCHOR batches and 1 INST batches
- Summed Squared Error (SSE) and Root Mean SE (RMSE)
- Plot the group ARLs
- Define Assimilation := ARL(N)-ARL(P) and plot Assim profile
- Final Figure
- Clean up and archive workspace
Load empirical ARL2 profiles
clear all
cd(fullfile(work_pathstr,'CMUExper','fdbk1','data')) ;
load('S2.mat') ;
ARL2 = [S2(:).ARL2] ;    % 9x55
gr=[S2(:).group]' ;
ugr = unique(gr) ;
N_groups = length(ugr) ;
ugr_descr = {'U1' 'L1' 'H1', 'L2' 'H2' } ;   % [1 2 3, 5 6]
fdbk_first_p = [1 1 1 , 0 0] ;    % exp schedule by group

%- Collapse across groups
grARL2 = zeros(size(ARL2,1),N_groups) ;   % 9x5
gr_idx = cell(1,N_groups) ;
for k = 1:N_groups
    gr_idx{k} = find(gr==ugr(k))' ;
    grARL2(:,k) = mean(ARL2(:,gr_idx{k}),2) ;
end
empir_Assim = grARL2(:,[3 find(ugr==6)]) - grARL2(:,[2 find(ugr==5)]) ;

N_runs_per_group = 250 ;
ANCHOR -- Explore 4 alternative sets
See ./fit_ANCHOR_ARL2_part2.m and ./html/fit_ANCHOR_ARL2_part2.html
H_set      = [.030 .040 .050 .060] ;
mem_k_set  = [.099 .083 .080 .065] ;
temper_set = [.022 .032 .046 .050] ;
aP = anchor_params ;       % anchor model
N_cat = 7 ; aP.N_cat = N_cat ;
aP.anchors = default_anchors([.420 .660],N_cat) ;
aP.avail = [1:N_cat]' ;
aP.cutoffs = .60 .* [-3 -1 .75 3*.75] ;
aP.history = .040 ;
aP.mem_k = .083 ;
aP.temper = .032
aP =
       scale: 'LINEAR'
       N_cat: 7
     SM_conv: 1.0000e-03
      cat_sz: 0.0500
      perc_k: 0.0400
       mem_k: 0.0830
       avail: [7x1 double]
     anchors: [7x6 double]
     cutoffs: [-1.8000 -0.6000 0.4500 1.3500]
      temper: 0.0320
     history: 0.0400
       alpha: 0.3000
       decay: 0.5000
         ITI: 4
    M_raster: 7
    A_raster: [5 5 3 3]
    mnfieldp: 1
INST
See ./fit_INST_ARL2_part2.m and ./html/fit_INST_ARL2_part2.html
iP = protoanchor_params([1:N_cat]) ;  % INST model (aka "protoanchor")
iP.cutoffs = .60 .* [-3 -1 .70 3*.70] ;
iP.history = .050 ;
iP.mem_k = .050 ;
iP.temper = .030
iP =
        scale: 'LINEAR'
        N_cat: 7
      SM_conv: 1.0000e-03
       cat_sz: 0.0400
       perc_k: 0.0400
        mem_k: 0.0500
        avail: [7x1 double]
    instances: [7x3 double]
      cutoffs: [-1.8000 -0.6000 0.4200 1.2600]
       temper: 0.0300
      history: 0.0500
        alpha: 0.3000
        decay: 0.5000
          ITI: 4
Figure layouts
The figures below will have 6 subplots: 4 ANCHOR + 1 INST 3x2 layout: [a1 a3 i1 ; a2 a4 i2]
N_A_sets = length(H_set) ;   % # of ANCHOR parameter sets
N_I_sets = 1 ;
Run 4 ANCHOR batches and 1 INST batches
fname = 'final_ARL2_fits.mat' ;
if (file_exists(fname))
    load(fname) ;
else
  %- ANCHOR
  aSSE = zeros(1,N_A_sets) ;
  aRMSE = zeros(1,N_A_sets) ;
  for k = 1:N_A_sets
      H = H_set(k) ;
      mem_k = mem_k_set(k) ;
      temper = temper_set(k) ;
      aP.history = H ;
      aP.mem_k = mem_k ;
      aP.temper = temper ;
      [gr_aARL{k},aARL{k}] = run_ANCHOR_fdbk1(...
          'model_params',aP,'groups',ugr','N_runs',N_runs_per_group) ;
      g = gr_aARL{k}(:,ugr) - grARL2 ;
      aSSE(k) = sum(g(:).^2) ;
      aRMSE(k) = sqrt(mean(g(:).^2)) ;
  end
  aSSE
  aRMSE
  %- INST
  iSSE = zeros(1,N_I_sets) ;
  iRMSE = zeros(1,N_A_sets) ;
  for k = 1:N_I_sets
      H = .050 ;
      mem_k = .050 ;
      temper = .030 ;
      iP.history = H ;
      iP.mem_k = mem_k ;
      iP.temper = temper ;
      [gr_iARL{k},iARL{k},Kargs] = run_INST_fdbk1(...
          'model_params',iP,'groups',ugr','N_runs',N_runs_per_group) ;
      g = gr_iARL{k}(:,ugr) - grARL2 ;
      iSSE(k) = sum(g(:).^2) ;
      iRMSE(k) = sqrt(mean(g(:).^2)) ;
  end
  iSSE
  iRMSE
  ARL_params = Kargs.ARL_params ;
end
Summed Squared Error (SSE) and Root Mean SE (RMSE)
aSSE = zeros(1,N_A_sets) ;
aRMSE = zeros(1,N_A_sets) ;
for k = 1:N_A_sets
    g = gr_aARL{k}(:,ugr) - grARL2 ;
    aSSE(k) = sum(g(:).^2) ;
    aRMSE(k) = sqrt(mean(g(:).^2)) ;
end
aSSE
aRMSE

iSSE = zeros(1,N_I_sets) ;
iRMSE = zeros(1,N_I_sets) ;
for k = 1:N_I_sets
    g = gr_iARL{k}(:,ugr) - grARL2 ;
    iSSE(k) = sum(g(:).^2) ;
    iRMSE(k) = sqrt(mean(g(:).^2)) ;
end
iSSE
iRMSE
aSSE =
    1.1265    1.0728    1.0693    1.1402
aRMSE =
    0.1582    0.1544    0.1542    0.1592
iSSE =
    1.3409
iRMSE =
    0.1726
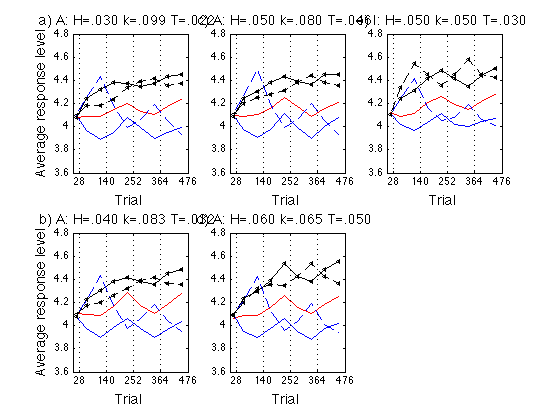
Plot the group ARLs
See .../fdbk1/data/model_ARL2_predictions.m
ls = {'r-' 'b-' 'k<-' 'r--' 'b--' 'k<--'} ;   % group line styles
lw = [.5 1.5 1.5  .5 1.5 1.5] ;                     % group line widths
ANCHOR_subplot_idx = [1 4 2 5] ;
INST_subplot_idx = [3 6] ;
ANCHOR_panel = {'a)' 'b)' 'c)' 'd)'} ;
INST_panel = {'e)' 'f)'} ;

endpts = ARL_params.endpoints ;    % [28 84 140 196 252 308 364 420 476]
step = endpts(3) - endpts(2) ;
x1 = endpts(1) ;
x = [x1/2 , [(endpts(2)+x1)/2:step:endpts(end)]]' ;
xtick = endpts(1:2:9) ;
%xtick = [0 endpts(1:2:9)] ;
ytick = [3.6:.2:4.8] ;
ax = [0 476 3.6 4.8] ;

clf ;
for k = 1:N_A_sets   % ANCHOR
    subpl = ANCHOR_subplot_idx(k) ;
    subplot(2,3,subpl) ;
    cla ; hold on ;
    for g = ugr'
        hh = plot(x,gr_aARL{k}(:,g),ls{g}) ;
        set(hh,'LineWidth',lw(g),'MarkerSize',4) ;
    end
    hold off ; box on ;
    hh = title(sprintf('%s A: H=.%03d k=.%03d T=.%03d ',...
           ANCHOR_panel{k},round(H_set(k)*1000),...
           round(mem_k_set(k)*1000),round(temper_set(k)*1000))) ;
    set(hh,'FontSize',14) ;
    axis(ax) ; set(gca,'xtick',xtick,'ytick',ytick,'xgrid','on') ;
    if 1  % (subpl>=4)
        hh = xlabel('Trial') ;
        set(hh,'FontSize',14) ;
    %else
    %    set(gca,'xticklabel',[]) ;
    end
    if (mod(subpl,3)==1)
        hh = ylabel('Average response level') ;
        set(hh,'FontSize',14) ;
    %else
    %    set(gca,'yticklabel',[]) ;
    end
end

for k = 1:N_I_sets   % INST
    subpl = INST_subplot_idx(k) ;
    subplot(2,3,subpl) ;
    cla ; hold on ;
    for g = ugr'
        hh = plot(x,gr_iARL{k}(:,g),ls{g}) ;
        set(hh,'LineWidth',lw(g),'MarkerSize',4) ;
    end
    hold off ; box on ;
    hh = title(sprintf('%s I: H=.%03d k=.%03d T=.%03d ',...
           INST_panel{k},round(.050*1000),round(.050*1000),round(.030*1000))) ;
    set(hh,'FontSize',14) ;
    axis(ax) ; set(gca,'xtick',xtick,'ytick',ytick,'xgrid','on') ;
    %set(gca,'yticklabel',[]) ;
    if 1  % (subpl>=4)
        hh = xlabel('Trial') ;
        set(hh,'FontSize',14) ;
    %else
    %    set(gca,'xticklabel',[]) ;
    end
end
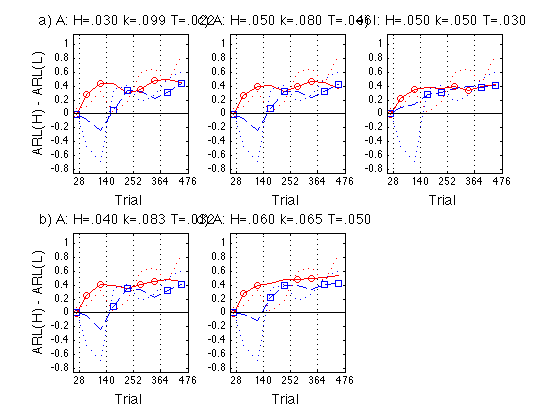
Define Assimilation := ARL(N)-ARL(P) and plot Assim profile
See .../fdbk1/data/model_ARL2_predictions.m
- 1 = Feedback first = Group 3 - Group 2
- 2 = No-feedback first = Group 6 - Group 5
ax = [0 476 -0.85 1.15] ;
ytick1 = [-.8:.2:1] ;

idx1 = [1 2 3 6 7] ;    % feedback blocks for the feedback-first groups
idx2 = [1 4 5 8 9] ;    % feedback blocks for the no-feedback-first grps

clf ;
for k = 1:N_A_sets   % ANCHOR
    Assim = gr_aARL{k}(:,[3 6]) - gr_aARL{k}(:,[2 5]) ;
    subpl = ANCHOR_subplot_idx(k) ;
    subplot(2,3,subpl) ;
    cla ; hold on ;
    hh = plot(x,Assim(:,1),'r-',x,Assim(:,2),'b--',...
              x(idx1),Assim(idx1,1),'ro',x(idx2),Assim(idx2,2),'bs',...
              x,empir_Assim(:,1),'r:',x,empir_Assim(:,2),'b:') ;
    set(hh(1:4),'LineWidth',1.5) ;
    axis(ax) ;
    hh=refline(0,0) ;
    set(hh,'Color','k','LineStyle','-','LineWidth',1) ;
    hold off ; box on ;
    hh = title(sprintf('%s A: H=.%03d k=.%03d T=.%03d ',...
           ANCHOR_panel{k},round(H_set(k)*1000),...
           round(mem_k_set(k)*1000),round(temper_set(k)*1000))) ;
    set(hh,'FontSize',14) ;
    axis(ax) ; set(gca,'xtick',xtick,'ytick',ytick1,'xgrid','on') ;
    if 1  % (subpl>=4)
        hh = xlabel('Trial') ;
        set(hh,'FontSize',14) ;
    %else
    %    set(gca,'xticklabel',[]) ;
    end
    if (mod(subpl,3)==1)
        hh = ylabel('ARL(H) - ARL(L)') ;
        set(hh,'FontSize',14) ;
    %else
    %    set(gca,'yticklabel',[]) ;
    end
    %hh = legend('Feedback first','No-feedback first',4) ;
    %set(hh,'FontSize',14) ;
end

for k = 1:N_I_sets   % INST
    Assim = gr_iARL{k}(:,[3 6]) - gr_iARL{k}(:,[2 5]) ;
    subpl = INST_subplot_idx(k) ;
    subplot(2,3,subpl) ;
    cla ; hold on ;
    hh = plot(x,Assim(:,1),'r-',x,Assim(:,2),'b--',...
              x(idx1),Assim(idx1,1),'ro',x(idx2),Assim(idx2,2),'bs',...
              x,empir_Assim(:,1),'r:',x,empir_Assim(:,2),'b:') ;
    set(hh(1:4),'LineWidth',1.5) ;
    axis(ax) ;
    hh=refline(0,0) ;
    set(hh,'Color','k','LineStyle','-','LineWidth',1) ;
    hold off ; box on ;
    hh = title(sprintf('%s I: H=.%03d k=.%03d T=.%03d ',...
           INST_panel{k},round(.050*1000),round(.050*1000),round(.030*1000))) ;
    set(hh,'FontSize',14) ;
    axis(ax) ; set(gca,'xtick',xtick,'ytick',ytick1,'xgrid','on') ;
    if 1  % (subpl>=4)
        hh = xlabel('Trial') ;
        set(hh,'FontSize',14) ;
    %else
    %    set(gca,'xticklabel',[]) ;
    end
    if (mod(subpl,3)==1)
        hh = ylabel('ARL(H) - ARL(L)') ;
        set(hh,'FontSize',14) ;
    %else
    %    set(gca,'yticklabel',[]) ;
    end
    %hh = legend('Feedback first','No-feedback first',4) ;
    %set(hh,'FontSize',14) ;
end
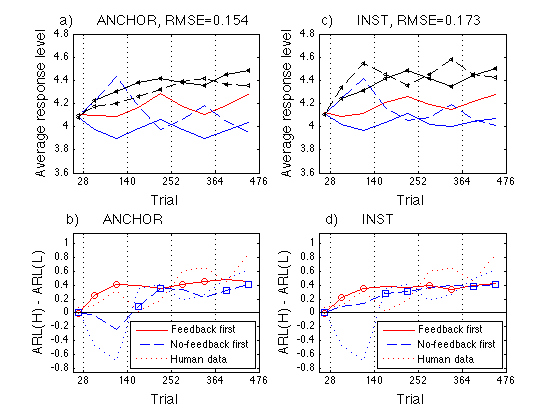
Final Figure
Single out ANCHOR parameter set #2 -- H=.040, mem_k=.083, T=.32
k = 2 ;
aP.history = H_set(k) ;
aP.mem_k = mem_k_set(k) ;
aP.temper = temper_set(k)

aAssim = gr_aARL{k}(:,[3 6]) - gr_aARL{k}(:,[2 5]) ;
iAssim = gr_iARL{1}(:,[3 6]) - gr_iARL{1}(:,[2 5]) ;

clf ;

ax = [0 476 3.6 4.8] ;
subplot(2,2,1) ;        % ANCHOR ARL2
cla ; hold on ;
for g = ugr'
    hh = plot(x,gr_aARL{k}(:,g),ls{g}) ;
    set(hh,'LineWidth',lw(g),'MarkerSize',4) ;
end
hold off ; box on ;
hh = title(sprintf('a)      ANCHOR, RMSE=%.3f     ',aRMSE(k))) ;
set(hh,'FontSize',14) ;
axis(ax) ; set(gca,'xtick',xtick,'ytick',ytick,'xgrid','on') ;
hh = xlabel('Trial') ; set(hh,'FontSize',14) ;
hh = ylabel('Average response level') ; set(hh,'FontSize',14) ;
%hh = legend('U1','L1','H1','L2','H2',3) ; set(hh,'FontSize',14) ;

subplot(2,2,2) ;        % INST ARL2
cla ; hold on ;
for g = ugr'
    hh = plot(x,gr_iARL{1}(:,g),ls{g}) ;
    set(hh,'LineWidth',lw(g),'MarkerSize',4) ;
end
hold off ; box on ;
hh = title(sprintf('c)      INST, RMSE=%.3f     ',iRMSE)) ;
set(hh,'FontSize',14) ;
axis(ax) ; set(gca,'xtick',xtick,'ytick',ytick,'xgrid','on') ;
hh = xlabel('Trial') ; set(hh,'FontSize',14) ;
hh = ylabel('Average response level') ; set(hh,'FontSize',14) ;
%hh = legend('U1','L1','H1','L2','H2',3) ; set(hh,'FontSize',14) ;

ax = [0 476 -0.85 1.15] ;
subplot(2,2,3) ;        % ANCHOR Assim
cla ; hold on ;
hh = plot(x,aAssim(:,1),'r-',x,aAssim(:,2),'b--',...
          x,empir_Assim(:,1),'r:',x,empir_Assim(:,2),'b:',...
          x(idx1),aAssim(idx1,1),'ro',x(idx2),aAssim(idx2,2),'bs') ;
set(hh,'LineWidth',1.5) ;
axis(ax) ;
hh=refline(0,0) ; set(hh,'Color','k','LineStyle','-','LineWidth',1) ;
hold off ; box on ;
hh = title('b)      ANCHOR                         ') ;
set(hh,'FontSize',14) ;
axis(ax) ; set(gca,'xtick',xtick,'ytick',ytick1,'xgrid','on') ;
hh = xlabel('Trial') ; set(hh,'FontSize',14) ;
hh = ylabel('ARL(H) - ARL(L)') ; set(hh,'FontSize',14) ;
hh = legend('Feedback first','No-feedback first','Human data',4) ;
%set(hh,'FontSize',14) ;

subplot(2,2,4) ;        % INST Assim
cla ; hold on ;
hh = plot(x,iAssim(:,1),'r-',x,iAssim(:,2),'b--',...
          x,empir_Assim(:,1),'r:',x,empir_Assim(:,2),'b:',...
          x(idx1),iAssim(idx1,1),'ro',x(idx2),iAssim(idx2,2),'bs') ;
set(hh,'LineWidth',1.5) ;
axis(ax) ;
hh=refline(0,0) ; set(hh,'Color','k','LineStyle','-','LineWidth',1) ;
hold off ; box on ;
hh = title('d)      INST                          ') ;
set(hh,'FontSize',14) ;
axis(ax) ; set(gca,'xtick',xtick,'ytick',ytick1,'xgrid','on') ;
hh = xlabel('Trial') ; set(hh,'FontSize',14) ;
hh = ylabel('ARL(H) - ARL(L)') ; set(hh,'FontSize',14) ;
hh = legend('Feedback first','No-feedback first','Human data',4) ;
%set(hh,'FontSize',14) ;
% Saved as work/papers/ProtoPaper/fig/final-fits.pdf
aP =
       scale: 'LINEAR'
       N_cat: 7
     SM_conv: 1.0000e-03
      cat_sz: 0.0500
      perc_k: 0.0400
       mem_k: 0.0830
       avail: [7x1 double]
     anchors: [7x6 double]
     cutoffs: [-1.8000 -0.6000 0.4500 1.3500]
      temper: 0.0320
     history: 0.0400
       alpha: 0.3000
       decay: 0.5000
         ITI: 4
    M_raster: 7
    A_raster: [5 5 3 3]
    mnfieldp: 1
Clean up and archive workspace
clear hh k g Assim Kargs x1 ;
clear aARL iARL ;  % not used anyway
save(fname) ;