fit_INST_ARL2_part2.m
Continued from fit_INST_ARL2_part1.m
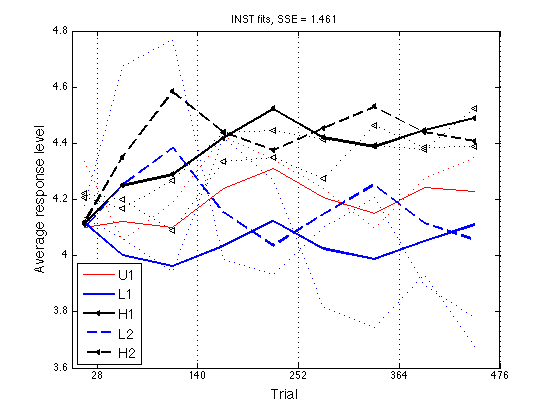
Fit the INST model (aka protoanchor) to the group ARL2 profiles of the Fdbk1 Experiment. The goal is to show that this model cannot fit these data very well.
The main tool is .../work/models/protoanchor/protoanchor_ARL2.m
File: work/CMUExper/fdbk1/data/fit_INST_ARL2_part2.m
Date: 2007-08-18
Alexander Petrov, http://alexpetrov.com
Contents
- Load the data
- Collapse across groups
- Fit INST on the same stimulus sequences, 11 per group
- Search parameters
- "Chance event" sets
- History weight grid
- Main work
- Plot the SSE
- Plot the Memory Noise Parameter
- Plot the Temperature Parameter
- Conclusion: Optimal INST Parameters
- Generate and ARL2 profiles with these parameters
- Plot the "optimal" ARL2 profiles
- Define Assimilation := ARL(N)-ARL(P) and plot Assim profile
- Clean up
Load the data
Start from scratch, generate new chev's, etc. The only thing used from fit_INST_ARL2_part1.m are the new cutoff parameter settingis and the new starting point for the searches.
clear all
cd(fullfile(work_pathstr,'CMUExper','fdbk1','data')) ;
load('S2.mat') ;
ARL2 = [S2(:).ARL2] ;    % 9x55
gr=[S2(:).group]' ;
ugr = unique(gr) ;
N_groups = length(ugr) ;
ugr_descr = {'U1' 'L1' 'H1', 'L2' 'H2' } ;   % [1 2 3, 5 6]
Collapse across groups
grARL2 = zeros(size(ARL2,1),N_groups) ;   % 9x5
gr_idx = cell(1,N_groups) ;
for k = 1:N_groups
    gr_idx{k} = find(gr==ugr(k))' ;
    grARL2(:,k) = mean(ARL2(:,gr_idx{k}),2) ;
end
Fit INST on the same stimulus sequences, 11 per group
stim = [S2(:).dist] ;   % 476x55
fdbk = [S2(:).fdbk] ;
Search parameters
Same search settings as in fit_INST_ARL2_part1.m Search strategy: 1. Fix cutoffs = .60 .* [-3 -1 .7 3*.7] once and for all 2. Explore history on a grid 3. Search for mem_k and temper using FMINCON as before but start from mem_k = .040, temper = .050 % perc_k = .040 as always
fminconp = 1 ;
flags = [0 1 1 0 0 0 0 0] ;   % [perc_k mem_k temper hist cutoff xx xx c_ratio]
Sparams = protoanchor_search_params(flags,fminconp) ;
optns = optimset(Sparams.optns,'TolX',1e-2,'Display','off') ;
Sparams.optns = optns ;
Sparams.target_vals = grARL2
Sparams.params.cutoffs = .60 .* [-3 -1 .7 3*.7] ;
Sparams.params.mem_k = .040 ;
Sparams.params.temper = .050 ;
Sparams.params.history = .040 ;
Sparams.params
Sparams =

     model_name: 'protoanchor_ARL2'
         params: [1x1 struct]
      p2v_templ: {'VAL = PARAMS.mem_k * 10 ;'  'VAL = PARAMS.temper * 10 ;'}
      v2p_templ: {'PARAMS.mem_k = VAL / 10 ;'  'PARAMS.temper = VAL / 10 ;'}
         bounds: [2x2 double]
     ARL_params: [1x1 struct]
    funfun_name: 'fmincon'
          optns: [1x1 struct]
     lsfun_name: 'sumsqerr'
    target_vals: [9x5 double]


ans =

        scale: 'LINEAR'
        N_cat: 7
      SM_conv: 1.0000e-03
       cat_sz: 0.0400
       perc_k: 0.0400
        mem_k: 0.0400
        avail: [7x1 double]
    instances: [7x3 double]
      cutoffs: [-1.8000 -0.6000 0.4200 1.2600]
       temper: 0.0500
      history: 0.0400
        alpha: 0.3000
        decay: 0.5000
          ITI: 4
"Chance event" sets
N_chevs = 3 ;

% Pack into "model data" structures suitable for passing as arguments.
Mdata = cell(1,N_chevs) ;
for k = 1:N_chevs
    Mdata{k}.stim = stim ;
    Mdata{k}.fdbk = fdbk ;
    Mdata{k}.group_idx = gr_idx ;
    %Mdata{k}.params = Sparams.params ;    % will be set by SUMSQERR
    Mdata{k}.chev = make_protoanchor_chev(size(stim,1),size(stim,2)) ;
    Mdata{k}.ARL_params = Sparams.ARL_params ;
end
History weight grid
history_levels = [.01 .02 .03 .04 .05 .06] ;
N_history_levels = length(history_levels) ;
Main work
fname = 'grid_search_INST_ARL2_part2.mat' ;
if (file_exists(fname))
    load(fname) ;
else
  grid_SSE = zeros([N_history_levels,N_chevs]) ;
  grid_mem_k = zeros([N_history_levels,N_chevs]) ;
  grid_temper = zeros([N_history_levels,N_chevs]) ;
  tic
  for k = 1:N_chevs
      fprintf('\n') ;
      for k1 = 1:N_history_levels
          Sparams.params.history = history_levels(k1) ;
          [par,SSE,optX,det] = paramsearch(Mdata{k},Sparams) ;  % <-- Sic!
          grid_SSE(k1,k) = SSE ;
          grid_mem_k(k1,k) = par.mem_k ;
          grid_temper(k1,k) = par.temper ;
          grid_det(k1,k) = det ;
          fprintf('%5.3f ',SSE) ;
          save(fname,'grid_SSE','grid_mem_k','grid_temper','grid_det',...
               'Sparams','history_levels') ;
      end
  end
  fprintf('\n') ;
  toc
end % if file_exists ...
1.498 1.495 1.602 1.231 1.204 1.256
1.482 1.266 1.407 1.090 0.891 1.301
1.508 1.405 1.519 1.456 1.277 1.287
Elapsed time is 10700.667700 seconds.
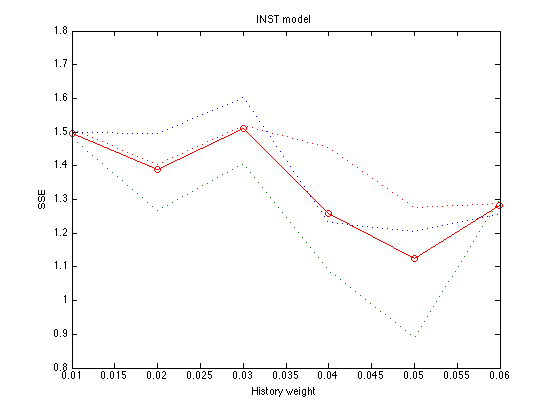
Plot the SSE
SSE = mean(grid_SSE,2) ;
SSE'
plot(history_levels,SSE,'ro-',history_levels,grid_SSE,':') ;
xlabel('History weight') ; ylabel('SSE') ; title('INST model') ;
ans =

    1.4958    1.3886    1.5095    1.2590    1.1240    1.2812
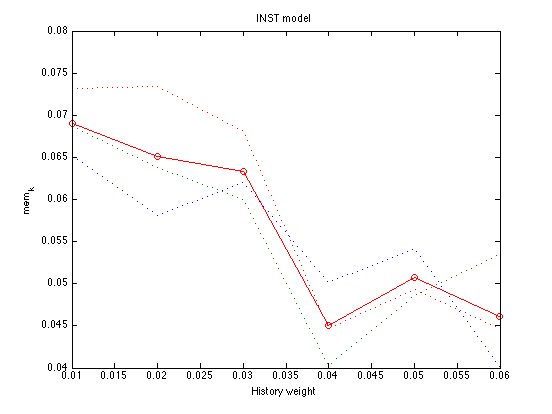
Plot the Memory Noise Parameter
mem_k = mean(grid_mem_k,2) ;
mem_k'
plot(history_levels,mem_k,'ro-',history_levels,grid_mem_k,':') ;
xlabel('History weight') ; ylabel('mem_k') ; title('INST model') ;
ans =

    0.0690    0.0651    0.0634    0.0450    0.0507    0.0461
Plot the Temperature Parameter
temper = mean(grid_temper,2) ;
temper'
plot(history_levels,temper,'ro-',history_levels,grid_temper,':') ;
xlabel('History weight') ; ylabel('temperature') ; title('INST model') ;
ans =

    0.0531    0.0313    0.0566    0.0280    0.0295    0.0380
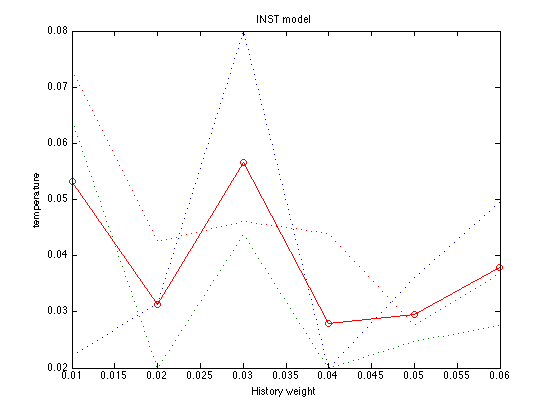
Conclusion: Optimal INST Parameters
All 3 replications minimize SSE for history = .050.
The optimal memory noise at this point is mem_k = .050
The optimal softmax temperature is temper = .030
Thus, the optimal parameters are:
Mparams = Sparams.params ;
Mparams.history = .050 ;
Mparams.mem_k = .050 ;
Mparams.temper = .030
Mparams =

        scale: 'LINEAR'
        N_cat: 7
      SM_conv: 1.0000e-03
       cat_sz: 0.0400
       perc_k: 0.0400
        mem_k: 0.0500
        avail: [7x1 double]
    instances: [7x3 double]
      cutoffs: [-1.8000 -0.6000 0.4200 1.2600]
       temper: 0.0300
      history: 0.0500
        alpha: 0.3000
        decay: 0.5000
          ITI: 4
Generate and ARL2 profiles with these parameters
for k = 1:N_chevs
    Mdata{k}.params = Mparams ;
    opt_grARL2(:,:,k) = protoanchor_ARL2(Mdata{k}) ;
end
opt_grARL2 = mean(opt_grARL2,3) ;
[grARL2 opt_grARL2]
opt_SSE = (grARL2-opt_grARL2) ;
opt_SSE = sum(opt_SSE(:).^2)
ans =

    4.3358    4.1354    4.2075    4.1789    4.2197    4.0995    4.1154    4.1120    4.0960    4.1186
    4.0525    4.0594    4.1666    4.6730    4.1990    4.1222    4.0010    4.2498    4.2497    4.3485
    4.1878    3.9444    4.2666    4.7687    4.0890    4.1001    3.9631    4.2882    4.3840    4.5829
    4.4236    4.4190    4.4370    3.9850    4.3336    4.2385    4.0353    4.4185    4.1551    4.4402
    4.3422    4.2662    4.4461    3.9343    4.3488    4.3109    4.1224    4.5227    4.0357    4.3752
    4.2404    3.8147    4.4136    4.1016    4.2765    4.2065    4.0248    4.4196    4.1479    4.4531
    4.0962    3.7438    4.3909    4.2058    4.4644    4.1516    3.9881    4.3878    4.2522    4.5303
    4.2742    3.9327    4.3790    3.8922    4.3864    4.2415    4.0514    4.4458    4.1150    4.4386
    4.3494    3.6773    4.5247    3.7794    4.3898    4.2281    4.1102    4.4891    4.0566    4.4067


opt_SSE =

    1.4608
Plot the "optimal" ARL2 profiles
ls = {'r-' 'b-' 'k<-' 'b--' 'k<--'} ;   % group line styles
lw = [1 2 2  2 2] ;                     % group line widths
els  = {'r:' 'b:' 'k<:' 'b:' 'k<:'} ;   % empirical-data line styles

x2 = [14 , 56:56:448]' ;
xtick = [28 , 140:112:476] ;
ytick = [3.6:.2:4.8] ;
ax = [0 476 3.6 4.8] ;

clf ; hold on ;
for k = 1:N_groups
    hh = plot(x2,opt_grARL2(:,k),ls{k}) ;
    set(hh,'LineWidth',lw(k),'MarkerSize',4) ;
end
for k = 1:N_groups
    plot(x2,grARL2(:,k),els{k}) ;
end
hold off ; box on ;
axis(ax) ; set(gca,'xtick',xtick,'ytick',ytick,'xgrid','on') ;
hh = xlabel('Trial') ; set(hh,'FontSize',14) ;
hh = ylabel('Average response level') ; set(hh,'FontSize',14) ;
hh = legend('U1','L1','H1','L2','H2',3) ; set(hh,'FontSize',14) ;
title(sprintf('INST fits, SSE = %.3f',opt_SSE)) ;
Define Assimilation := ARL(N)-ARL(P) and plot Assim profile
See .../CMUExper/fdbk1/data/empir_ARL2_profile.m
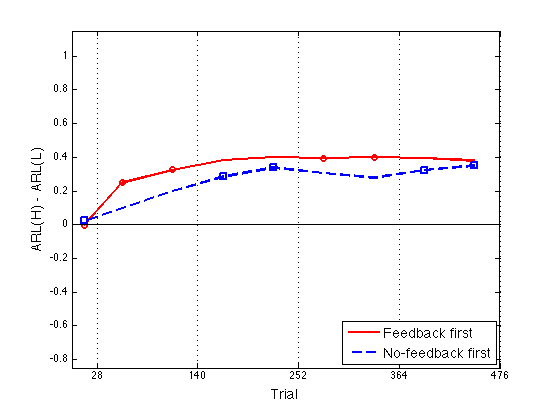
%Assim = grARL2(:,[3 find(ugr==6)]) - grARL2(:,[2 find(ugr==5)])
opt_Assim = opt_grARL2(:,[3 find(ugr==6)]) - opt_grARL2(:,[2 find(ugr==5)])

ax = [0 476 -0.85 1.15] ;
ytick1 = [-.8:.2:1] ;
idx1 = [1 2 3 6 7] ;    % feedback blocks for the feedback-first groups
idx2 = [1 4 5 8 9] ;    % feedback blocks for the no-feedback-first grps

clf ;
hh = plot(x2,opt_Assim(:,1),'r-',x2,opt_Assim(:,2),'b--',...
          x2(idx1),opt_Assim(idx1,1),'ro',x2(idx2),opt_Assim(idx2,2),'bs') ;
    set(hh,'LineWidth',2) ;
    axis(ax) ;
    hh=refline(0,0) ;
    set(hh,'Color','k','LineStyle','-','LineWidth',1) ;
box on ;
axis(ax) ; set(gca,'xtick',xtick,'ytick',ytick1,'xgrid','on') ;
hh = xlabel('Trial') ; set(hh,'FontSize',14) ;
hh = ylabel('ARL(H) - ARL(L)') ; set(hh,'FontSize',14) ;
hh = legend('Feedback first','No-feedback first',4) ; set(hh,'FontSize',14) ;
opt_Assim =

   -0.0034    0.0226
    0.2488    0.0987
    0.3251    0.1989
    0.3833    0.2851
    0.4003    0.3395
    0.3948    0.3051
    0.3997    0.2782
    0.3944    0.3236
    0.3789    0.3502
Clean up
clear k k1 hh ax ;