MODEL_ARL2_PREDICTIONS.m
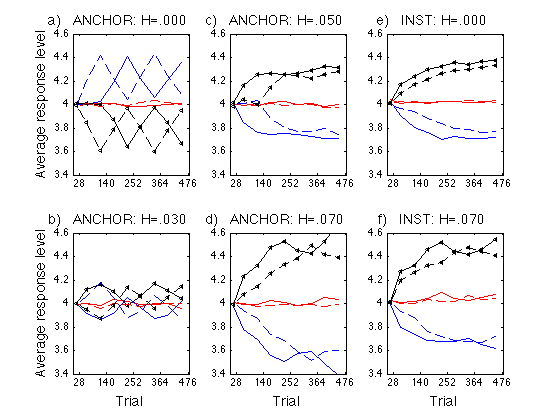
Figure 2 in .../papers/ProtoPaper/protopaper.tex
Based on .../fdbk1/data/ANCHOR_ARL2_profiles.m and INST_ARL2_profiles.m
File: work/CMUExper/fdbk1/data/model_ARL2_predictions.m
Date: 2007-06-22
Alexander Petrov, http://alexpetrov.com
Contents
Prepare parameters
clear all
cd(fullfile(work_pathstr,'CMUExper','fdbk1','data')) ;
N_runs_per_group = 250 ;
groups = [1 2 3 4 5 6] ;
fdbk_first_p = [1 1 1 0 0 0] ;    % exp schedule by group
gr_descr = {'Ufb','Pfb','Nfb','xxx','Pno','Nno' } ;

%- ANCHOR
cutoffs = [-3 -1 +1 +3].*0.80 ;
H = 0.040 ;
%cutoffs = [-3 -1 +1*.7 +3*.7].*0.80 ;  % better fit the upward drift
%H = 0.040 ;
aP = anchor_params ;       % anchor model
aP.N_cat = 7 ;
aP.anchors = default_anchors([.420 .660],7) ;
aP.history = H ;
aP.cutoffs = cutoffs ;

%- INST
iP = protoanchor_params([1:7]) ;  % instance-based model (aka "protoanchor")
iP.history = H ;
iP.cutoffs = cutoffs ;

%- Figure layouts
% The figures below will have 6 subplots: 4 ANCHOR + 2 INST
% 3x2 layout:   [a1 a3 i1 ; a2 a4 i2]
aH_set = [.000 .030 .050 .070] ;    % ANCHOR history parameter range
iH_set = [.000 .070] ;              % INST history parameter range
Run 4 ANCHOR batches and 2 INST batches
for k = 1:4
    H = aH_set(k) ;
    aP.history = H ;
    [gr_aARL{k},aARL{k}] = run_ANCHOR_fdbk1(...
        'model_params',aP,'groups',groups,'N_runs',N_runs_per_group) ;
end
for k = 1:2
    H = iH_set(k) ;
    iP.history = H ;
    [gr_iARL{k},iARL{k},Kargs] = run_INST_fdbk1(...
        'model_params',iP,'groups',groups,'N_runs',N_runs_per_group) ;
end
ARL_params = Kargs.ARL_params ;
Plot the group ARLs
See CMUExper/fdbk1/data/assimil_profiles.m
ls = {'r-' 'b-' 'k<-' 'r--' 'b--' 'k<--'} ;   % group line styles
lw = [.5 1.5 1.5  .5 1.5 1.5] ;                     % group line widths
ANCHOR_subplot_idx = [1 4 2 5] ;
INST_subplot_idx = [3 6] ;
ANCHOR_panel = {'a)' 'b)' 'c)' 'd)'} ;
INST_panel = {'e)' 'f)'} ;

endpts = ARL_params.endpoints ;    % [28 84 140 196 252 308 364 420 476]
step = endpts(3) - endpts(2) ;
x1 = endpts(1) ;
x = [x1/2 , [(endpts(2)+x1)/2:step:endpts(end)]]' ;
xtick = endpts(1:2:9) ;
%xtick = [0 endpts(1:2:9)] ;
ytick = [3.4:.2:4.6] ;
ax = [0 480 3.4 4.6] ;

clf ;
for k = 1:4   % ANCHOR
    subpl = ANCHOR_subplot_idx(k) ;
    subplot(2,3,subpl) ;
    cla ; hold on ;
    for g = groups
        hh = plot(x,gr_aARL{k}(:,g),ls{g}) ;
        set(hh,'LineWidth',lw(g),'MarkerSize',4) ;
    end
    hold off ; box on ;
    hh = title(sprintf('%s   ANCHOR: H=.%03d      ',...
           ANCHOR_panel{k},round(aH_set(k)*1000))) ;
    set(hh,'FontSize',14) ;
    axis(ax) ; set(gca,'xtick',xtick,'ytick',ytick) ;
    if (subpl>=4)
        hh = xlabel('Trial') ;
        set(hh,'FontSize',14) ;
    %else
    %    set(gca,'xticklabel',[]) ;
    end
    if (mod(subpl,3)==1)
        hh = ylabel('Average response level') ;
        set(hh,'FontSize',14) ;
    %else
    %    set(gca,'yticklabel',[]) ;
    end
end

for k = 1:2   % INST
    subpl = INST_subplot_idx(k) ;
    subplot(2,3,subpl) ;
    cla ; hold on ;
    for g = groups
        hh = plot(x,gr_iARL{k}(:,g),ls{g}) ;
        set(hh,'LineWidth',lw(g),'MarkerSize',4) ;
    end
    hold off ; box on ;
    hh = title(sprintf('%s   INST: H=.%03d      ',...
           INST_panel{k},round(iH_set(k)*1000))) ;
    set(hh,'FontSize',14) ;
    axis(ax) ; set(gca,'xtick',xtick,'ytick',ytick) ;
    %set(gca,'yticklabel',[]) ;
    if (subpl>=4)
        hh = xlabel('Trial') ;
        set(hh,'FontSize',14) ;
    %else
    %    set(gca,'xticklabel',[]) ;
    end
end
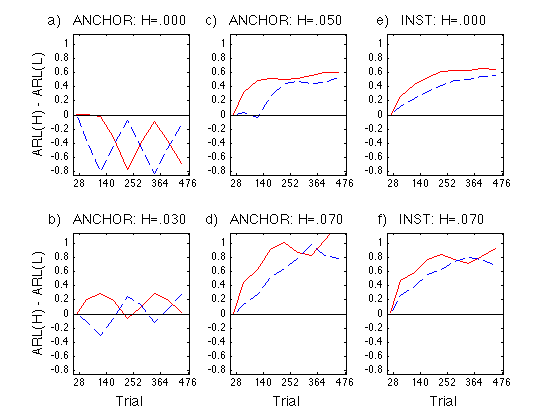
Define Assimilation := ARL(N)-ARL(P) and plot Assim profile
See CMUExper/fdbk1/data/assimil_profiles.m
- 1 = Feedback first = Group 3 - Group 2
- 2 = No-feedback first = Group 6 - Group 5
ax = [0 480 -0.85 1.15] ;
ytick1 = [-.8:.2:1] ;

clf ;
for k = 1:4   % ANCHOR
    subpl = ANCHOR_subplot_idx(k) ;
    subplot(2,3,subpl) ;
    cla ; hold on ;
    for g = groups
        Assim = gr_aARL{k}(:,[3 6]) - gr_aARL{k}(:,[2 5]) ;  % <-- Sic!
        hh = plot(x,Assim(:,1),'r-',x,Assim(:,2),'b--') ;
        set(hh,'LineWidth',1.5) ;
        axis(ax) ;
        hh=refline(0,0) ;
        set(hh,'Color','k','LineStyle','-','LineWidth',1) ;
    end
    hold off ; box on ;
    hh = title(sprintf('%s   ANCHOR: H=.%03d      ',...
           ANCHOR_panel{k},round(aH_set(k)*1000))) ;
    set(hh,'FontSize',14) ;
    axis(ax) ; set(gca,'xtick',xtick,'ytick',ytick1) ;
    if (subpl>=4)
        hh = xlabel('Trial') ;
        set(hh,'FontSize',14) ;
    %else
    %    set(gca,'xticklabel',[]) ;
    end
    if (mod(subpl,3)==1)
        hh = ylabel('ARL(H) - ARL(L)') ;
        set(hh,'FontSize',14) ;
    %else
    %    set(gca,'yticklabel',[]) ;
    end
end
%legend('Feedback first','No-feedback first',4) ;

for k = 1:2   % INST
    subpl = INST_subplot_idx(k) ;
    subplot(2,3,subpl) ;
    cla ; hold on ;
    for g = groups
        Assim = gr_iARL{k}(:,[3 6]) - gr_iARL{k}(:,[2 5]) ;  % <-- Sic!
        hh = plot(x,Assim(:,1),'r-',x,Assim(:,2),'b--') ;
        set(hh,'LineWidth',1.5) ;
        axis(ax) ;
        hh=refline(0,0) ;
        set(hh,'Color','k','LineStyle','-','LineWidth',1) ;
    end
    hold off ; box on ;
    hh = title(sprintf('%s   INST: H=.%03d      ',...
           INST_panel{k},round(iH_set(k)*1000))) ;
    set(hh,'FontSize',14) ;
    axis(ax) ; set(gca,'xtick',xtick,'ytick',ytick1) ;
    if (subpl>=4)
        hh = xlabel('Trial') ;
        set(hh,'FontSize',14) ;
    %else
    %    set(gca,'xticklabel',[]) ;
    end
    if (mod(subpl,3)==1)
        hh = ylabel('ARL(H) - ARL(L)') ;
        set(hh,'FontSize',14) ;
    %else
    %    set(gca,'yticklabel',[]) ;
    end
end
%legend('Feedback first','No-feedback first',4) ;
Clean up
clear hh k g Assim Kargs x1 ;
clear aARL iARL ;  % not used anyway